


Master multi-timeframe analysis in trading with expert tips. Uncover hidden trends and gain the edge you need to trade like a pro.
The multi-timeframe analysis technique is used by professional traders to understand both the broader picture of the market price action as well as the immediate short-term movements. This helps them in gaining an edge. This blog provides insights about how to perform multi-timeframe analysis to improve your trading.
What is Multi-Timeframe Analysis?
The multi-timeframe analysis involves studying charts of different timeframes ranging from weekly charts (usually representing 1-3 years of data) to 15 or 30-minute charts (showing 5-7 days of data).
Using multiple timeframes in technical analysis helps in understanding the bigger trends using larger timeframes and using shorter timeframes for finding good entry and exit points. Benefits of multi-timeframe analysis can be enjoyed by all market participants, such as:
- Long-term Investors: Long-term investors use multi-timeframe analysis for finding better entry and exit opportunities using shorter timeframe charts.
- Intraday Traders: Intraday traders use multi timeframe analysis in trading to understand long-term trends. This helps them understand the long-term price action.
Benefits of Multi-Timeframe Analysis
Here are the benefits of multi timeframe analysis:
- Better Entry/ Exits: Shorter timeframes can help you in finding more favorable entry and exit opportunities. By identifying support and resistance zones on shorter timeframes, you can enter trades for lower prices and exit at higher prices. These levels are often hidden in bigger timeframes.
- Broader Perspective: When a trader analyses bigger timeframe charts, they get a perspective of where the bigger trends are heading. Larger timeframes also give major support and resistance levels.These trends can also provide information about which sectors have been receiving investment flows.
- Trading Signals Across Timeframes: A support or resistance level or a reversal signal that gets confirmed on different timeframes has a higher probability of success.
For example, HBL Engineering’s limited stock price formed a double bottom pattern on a 30-minute chart, which witnessed a breakout on 19th March 2025, with high volume. This is a bullish sign.
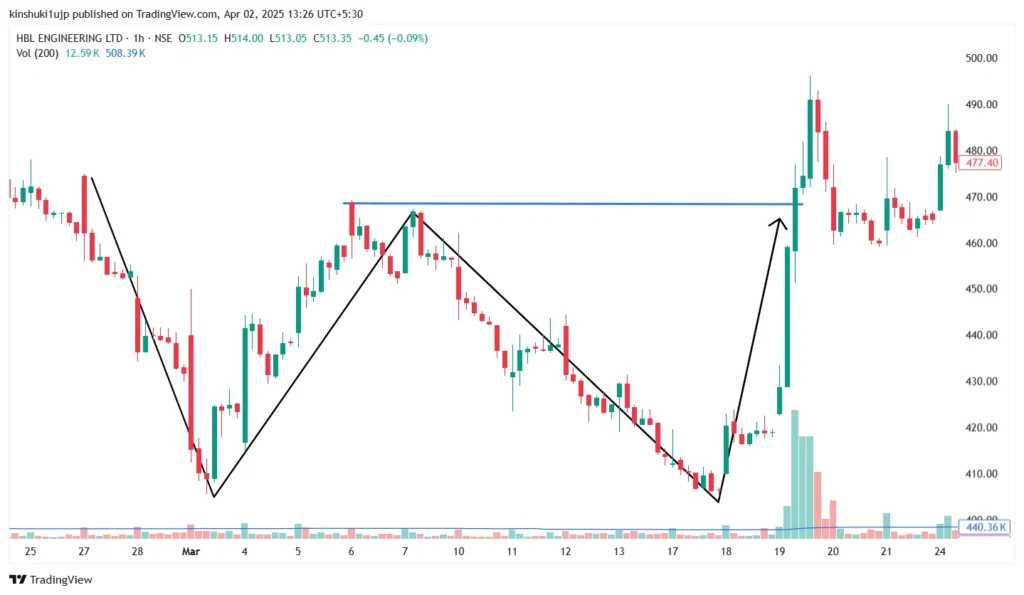
Source: Tradingview; HBL Engineering – 1hour chart, showing a double bottom pattern formation in March 2025.
This formation gained even more reliability as it formed in the support zone of 400-425 level on the daily charts.
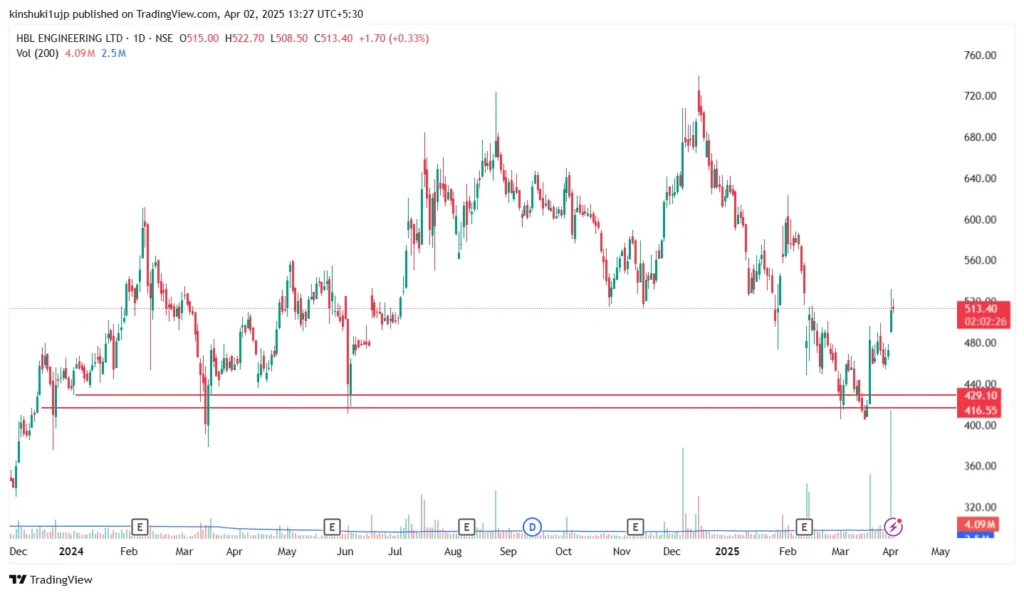
Source: Tradingview; HBL Engineering – 1 day chart.
This provided a bullish signal on different timeframes, and increased the chances of success of this pattern.
- Adaptability to Different Market Conditions: Market conditions can either be trending or ranging. To avoid poor trades, traders can evaluate multiple timeframes and adapt their multi-time frame trading strategies to suit prevailing market conditions.
Steps by Step Guide to Multi-Timeframe Analysis
Let us look at the process of how to perform multi-timeframe analysis:
Step 1: Analyse Long Term Trend
The first step in multi-time frame trading strategies is analyzing the long-term trend of the markets. This includes looking at the weekly charts and understanding the long-term trends of the markets. This can be a sideways consolidation, an uptrend, or a downtrend.
Along with the trend, a trader needs to identify the support and resistance zone on the bigger time frame charts.
For example, you can look at the weekly chart of SBI Life Insurance Company, which shows a strong uptrend since 2020.
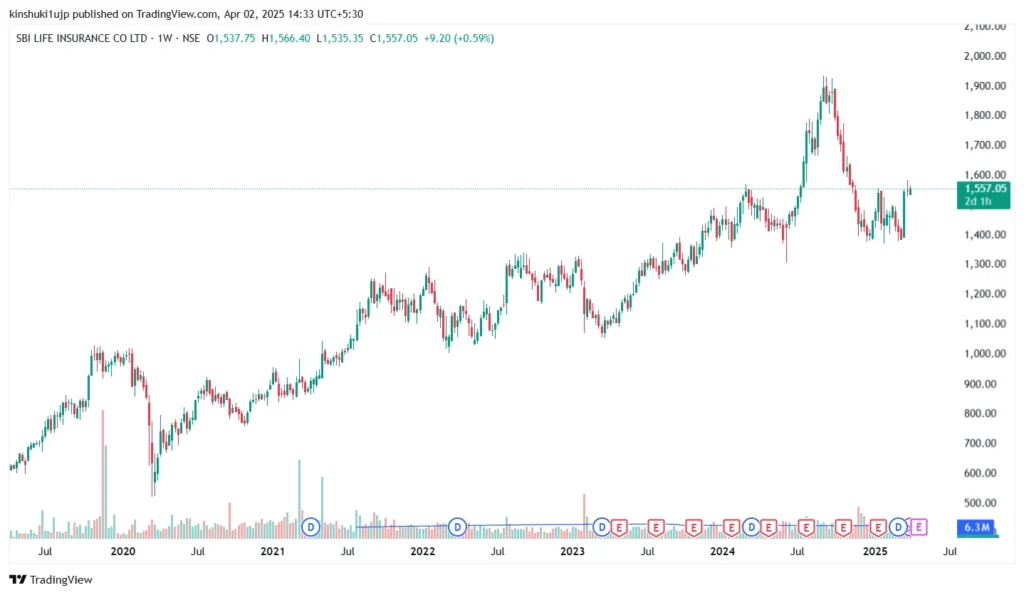
Source: Tradingview, SBI Life Insurance – weekly Chart, showing strong uptrend
This shows that the stock has been presenting good financial performance, which has led to strong demand and a long-term uptrend in the stock.
Step 2: Analyse Medium Term Trends
The next step is to analyse the medium-term price action using the daily charts. Shorter trends, sideways consolidation, support and resistance zones, or chart patterns can form inside the major long-term trend. The medium-term charts show more recent market sentiment. For example, The weekly chart of SBI Life Insurance Company Limited showed a good uptrend for the past five years. But when you look at the medium-term trends using daily charts, you can observe that the stock is in a consolidation mode between 1550-1560 and 1400-1385 levels after a downtrend.
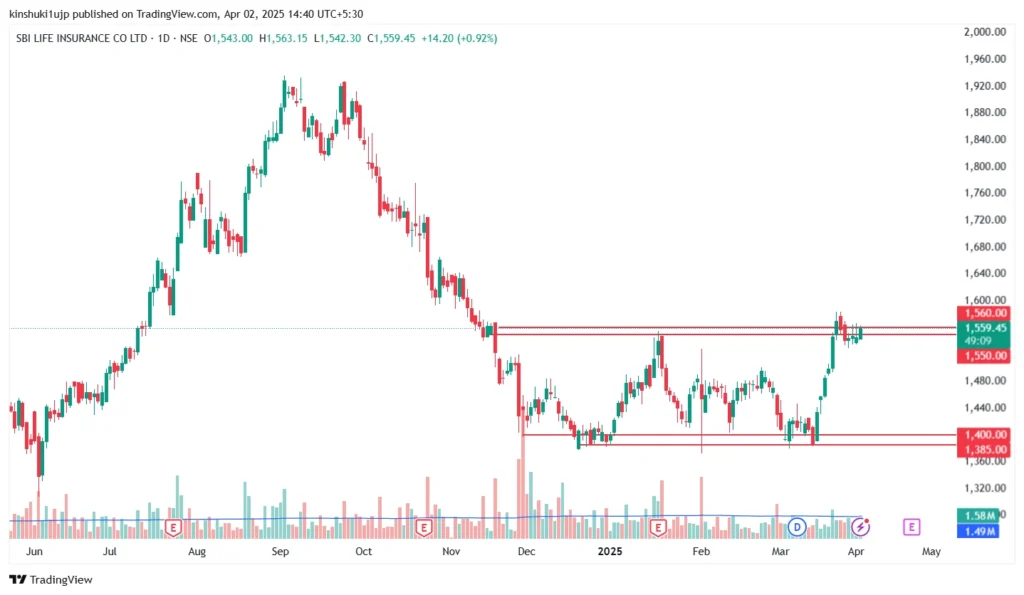
Source: Tradingview, SBI Life Insurance – Daily Chart, showing sideways consolidation
This shows that in the medium term (past 6-8 months), the sentiment for this stock has been negative, which is in line with the negative sentiment in the broader markets.
Step 3: Analyse Short-Term Trends
The last step in this process is analyzing the short-term trends. Traders can use 15-minute or 30-minute timeframe charts for this purpose. Traders usually use these charts for receiving trading signals and finding favorable entry/exit points.
For example, when we zoom in further on the price chart of SBI Life Insurance Company Limited, we can observe a symmetrical triangle forming very close to the resistance zone (identified in the medium term).
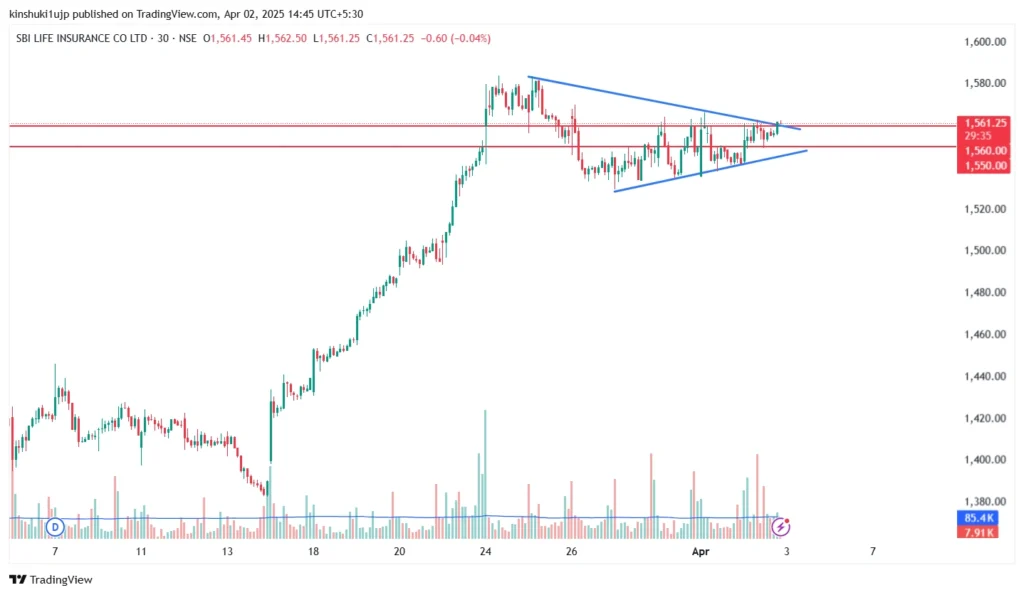
Source: Tradingview, SBI Life Insurance – 30-minutes Chart, showing symmetrical triangle pattern.
Traders use these shorter time frame charts for entering the stock.
Multi-Timeframe Analysis Result
To complete our analysis with our example, suppose the symmetrical triangle pattern breaks on the upside. Traders might look at this as the breakout from a short-term pattern and a breakout from a medium-term resistance zone. This might be seen as a possible bullish signal using multiple timeframes.
If this pattern breaks on the downside, it might be seen as a sell-off from a medium-term resistance and a short-term pattern failure. Please remember that this is just an example of a multi timeframe trading strategy for clear understanding. In reality, along with the price action analysis, professional traders also use multiple tools like technical indicators and Fibonacci levels for a more accurate multi-time frame analysis in trading.
Key Considerations for Multi-Timeframe Analysis
Keep these points in mind while using multi-timeframe in technical analysis:
- Bigger Timeframes are More Reliable: Market noise can be filtered out, and stronger signals can be provided by larger timeframes. For example, Compared to a breakout on a 5-minute chart, a breakout on a weekly chart can be more significant.
- Do Not Use More than 3-4 Timeframes: Three or Four timeframe charts can provide you with a good picture of long and short-term price action. Using too many timeframes can lead to confusion.
Conclusion
Multi-Timeframe Analysis in trading serves as a key tool for traders to grasp the full picture of the markets. Looking at various timeframes helps traders spot better points to enter and exit trades and adjust to market changes well. Still, it’s key to strike a balance in the number of timeframes used to avoid too much data. When used right, it can boost trading consistency and success.
DISCLAIMER: The information given in this blog is for educational purposes only. Any content of this blog is not investment advice.


