


Think of a mutual fund factsheet as your fund’s report card, except instead of grades in maths and english, you get numbers on returns, risks, and where your money actually sits. Most investors scroll past it or find it overwhelming. But once you know what to look for, a factsheet tells you more about a fund than any advertisement ever will. Let’s understand how to read the factsheet of a mutual fund through a real example below.
What is a Mutual Fund Factsheet?
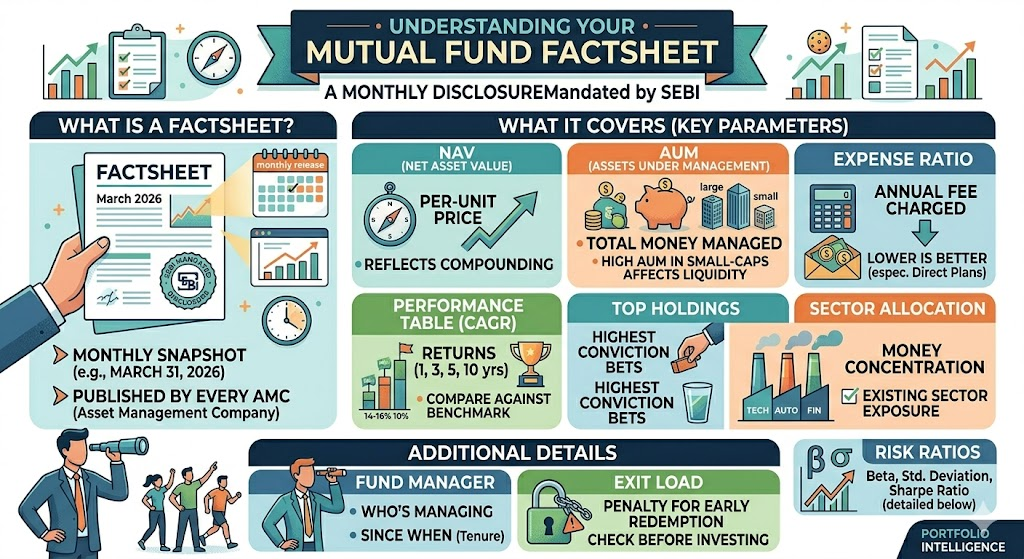
Every Asset Management Company (AMC) releases a monthly document that talks about the details related to each mutual fund under their banner. This document works like a report card and is called a ‘factsheet’. SEBI mandates its disclosure, and it covers everything from portfolio holdings and sector allocation to fund manager details, expense ratios, and risk ratios. It is essentially a snapshot of where the fund stands at the end of each month.
Most AMCs issue their factsheets within the first week of the coming month. Hence, the March 2026 factsheet tells you where a fund stood as of March 31, 2026.
What to Observe in a Mutual Fund Factsheet
A factsheet contains several data points, with each holding a unique relevance. The key parameters to track are:
- NAV (Net Asset Value): The per-unit price of the fund is called NAV. A higher NAV does not imply that the fund is expensive; it reflects how long it has compounded.
- AUM (Assets Under Management): AUM reflects the total fund base managed by the fund. Very high AUM in small-cap funds can affect liquidity and returns.
- Expense Ratio: The annual maintenance charges charged to manage your money is expressed as the expense ratio. Lower is better, especially in direct plans.
- Performance Table (CAGR): Returns over 1, 3, 5, and 10 years are represented in a performance table. Always compare against the benchmark.
- Top Holdings: The stocks the fund has bet on most heavily is under ‘top holdings’. This tells you the fund’s conviction.
- Sector Allocation: Sector allocation shows where the money is concentrated. It is useful to check if you are already overweight in a sector elsewhere.
- Risk Ratios: Beta, Standard Deviation, and Sharpe Ratio of the fund show its risk measures. It is further explained in detail below.
- Exit Load: The penalty for early redemption is called ‘exit load’ and is important to know before you invest.
Fund Manager: Who is managing your money and since when is also mentioned in a factsheet.
Why These Parameters Matter
A fund’s past returns alone cannot tell you if it is a good fit for your portfolio. The risk ratios add the missing context.
| Ratio | What it Tells You | Interpretation |
| Beta | How the fund moves relative to the market | Beta < 1 = less volatile than market; > 1 = more volatile |
| Standard Deviation | How much returns fluctuate | Higher SD = wider swings in NAV |
| Sharpe Ratio | How much extra returns are earned per unit of risk | Higher is better; above 1 is considered strong |
| Information Ratio | Consistency of outperforming the benchmark | Higher means more reliable outperformance |
A fund with high returns but a very high standard deviation and low Sharpe Ratio is generating those returns by taking on disproportionate risk. That is worth knowing before you commit.
Breaking Down a Real Life Mutual Fund Factsheet
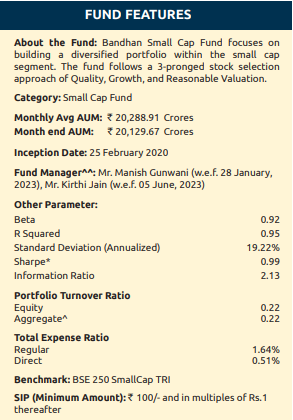
Let’s break down Bandhan Small Cap Fund’s recent factsheet. It is one of the larger small-cap funds in India, and its numbers reveal quite a few things about how it has been positioned.
Source: Bandhan Mutual Fund
Basic Fund Details
| Parameter | Details |
| Fund Category | Small Cap Fund |
| Inception Date | 25 February 2020 |
| Month-End AUM | ₹20,129.67 Crores |
| Benchmark | BSE 250 SmallCap TRI |
| Fund Managers | Mr. Manish Gunwani & Mr. Kirthi Jain |
| NAV (Regular Growth) | ₹40.56 |
| Expense Ratio (Regular) | 1.64% |
| Expense Ratio (Direct) | 0.51% |
| Exit Load | 1% if redeemed within 1 year |
The AUM of ₹20,130 crores is large, and it shows the fund manager has a big corpus to manage.
Performance: How Has It Done?
| Period | Fund CAGR | Benchmark CAGR | Nifty 50 TRI |
| 1 Year | -0.22% | -5.83% | -3.97% |
| 3 Years | 26.09% | 16.36% | 10.03% |
| 5 Years | 20.21% | 15.43% | 10.01% |
| Since Inception | 25.82% | 18.67% | 12.33% |
The fund has significantly outperformed its benchmark across all meaningful time horizons. A ₹10,000 investment at inception (February 2020) has grown to ₹40,564 — the benchmark would have given ₹28,388 for the same investment. That excess is the ‘alpha’ the fund has successfully generated.
The 1-year return is marginally negative at -0.22%, but it still comfortably beats both the benchmark (-5.83%) and Nifty 50 (-3.97%), which reflects the broader market downturn in early 2026 driven by global uncertainty and the West Asia conflict.
Risk Ratios: Reading Between the Lines
| Ratio | Value | Interpretation |
| Beta | 0.92 | Slightly less volatile than the overall market |
| Standard Deviation | 19.22% | Significant price swings — typical for small cap funds |
| Sharpe Ratio | 0.99 | Close to 1, meaning strong risk-adjusted returns |
| Information Ratio | 2.13 | Exceptionally consistent benchmark outperformance |
The Sharpe Ratio of 0.99 and the Information Ratio of 2.13 are important to note. The Information Ratio in particular suggests the managers have been consistently adding value over the benchmark.
Portfolio Composition
The market cap allocation as of March 2026 shows 67% in small-cap stocks, 15.67% in mid-cap stocks, 4.63% in large-cap stocks, and 12.69% in cash. This aligns with SEBI’s requirements of small-cap funds holding at least a 65% portion in small-cap stocks.
The high cash holdings of 12.69% signals the fund managers are being selective rather than deploying money at any price, often a sign of discipline in a heated small cap segment.
Top holdings include REC (3.57%), Sobha (3.25%), and LT Foods (2.27%) — a mix of finance, realty, and agri-food, reflecting the fund’s overweight in Financial Services (27.6% vs. 19.2% in the index) and Realty (7.8% vs. 2% in the index).
The portfolio turnover ratio of just 0.22 means the managers are not trading frequently — this is a buy-and-hold style approach, which generally keeps transaction costs low.
Conclusion
A mutual fund factsheet is not complicated to understand. Once you know where to look, the numbers lay out exactly what a fund is doing, how it is performing relative to its benchmark, and whether the risk it takes is proportionate to the return it delivers. The Bandhan Small Cap Fund factsheet for March 2026 is a solid example to explain how you must decode the next factsheet you encounter. Before your next SIP decision, pull up the factsheet.
Frequently Asked Questions
| 1. How often is a mutual fund factsheet updated? |
| Factsheets are published monthly by every AMC, typically within the first 7–10 days of the following month. So a March 2026 factsheet reflects data as of March 31, 2026. SEBI mandates this monthly disclosure for all mutual funds. |
| 2. What is a good Sharpe Ratio for a mutual fund? |
| There is no universal cutoff, but above 1 is where most analysts get comfortable — it means returns are outpacing the risk taken. Between 0.5 and 1 is acceptable, though not exceptional. Below 0.5, the fund is taking on more risk than its returns justify. For context, Bandhan Small Cap Fund’s Sharpe of 0.99 sits right at the threshold — a strong number for a small cap fund, where volatility is structurally higher. |
| 3. Should I invest in the direct plan or regular plan based on the factsheet? |
| The factsheet shows both expense ratios. For Bandhan Small Cap Fund, the direct plan charges 0.51% vs. 1.64% for the regular plan. Over long investment periods, that 1.13% difference compounds significantly. If you are investing independently through broker platforms, the direct plan is the more cost-efficient choice. |


