

The stock market is a financial system that connects companies looking to raise capital and investors looking for wealth creation and capital formation.
The Indian stock market has transformed from a niche investment avenue into one of the most important wealth-building tools available to retail investors. Millions of Indians now invest in shares, mutual funds, and exchange-traded funds to participate in the growth of businesses and work towards long-term financial goals.
This growing interest is reflected in the scale of the market itself. As of June 2026, the Indian stock market has a total market capitalisation of approximately USD 4.8 trillion, making India the 7th-largest stock market globally. The Indian market has also witnessed a remarkable rise in retail engagement, with the National Stock Exchange crossing 26 crore investor accounts in June 2026.
Historically, stocks or equities have consistently played an important role in wealth creation by allowing investors to participate in corporate earnings growth and economic development. While investor participation continues to grow, understanding how to invest in the share market in India for beginners is one of the most common challenges for new investors. The stock market can be overwhelming to beginners due to concepts such as stock exchanges, Nifty 50 vs Sensex difference, Demat accounts, stock selection, fundamental analysis for beginners, dividend investing, intraday vs delivery trading, and tax implications on market profits.
To help you navigate these concepts, this guide simplifies the learning process by covering everything a beginner should know. By the end of this guide, you will understand how the Indian stock market works, the differences between NSE and BSE, how to open a Demat and trading account, the various stock categories, including smallcap vs midcap vs largecap India, and the fundamentals of stock selection.
You will also learn how to analyse companies using fundamentals analysis, including how to read a balance sheet, and technical analysis, generate income through dividend stocks, compare trading and investing approaches, understand stock market taxation, and choose the right broker for your needs. Whether you are starting with ₹1,000 or building a larger portfolio, this guide will help you invest with greater confidence and clarity.
How the Indian Stock Market Works
The Indian stock market enables investors to acquire ownership in listed businesses through the purchase and sale of shares on recognised exchanges. When you purchase a company’s share, you technically become an owner of that company and participate in and benefit from its financial performance. Understanding this concept is the first step for anyone exploring how to invest in the share market in India for beginners.
The market operates through two segments:
- Primary Market: The primary market is where companies bring new shares to investors and raise capital for business expansion, debt reduction, operational needs, or other corporate objectives, often through an IPO. If you apply for shares during an IPO, you are participating in the primary market activity and buying directly from the company.
- Secondary Market: After a company completes its listing process, its shares are traded between investors on exchanges such as the NSE and BSE, with prices determined by market demand and supply. The issuing company does not participate in these routine buy and sell transactions between investors.
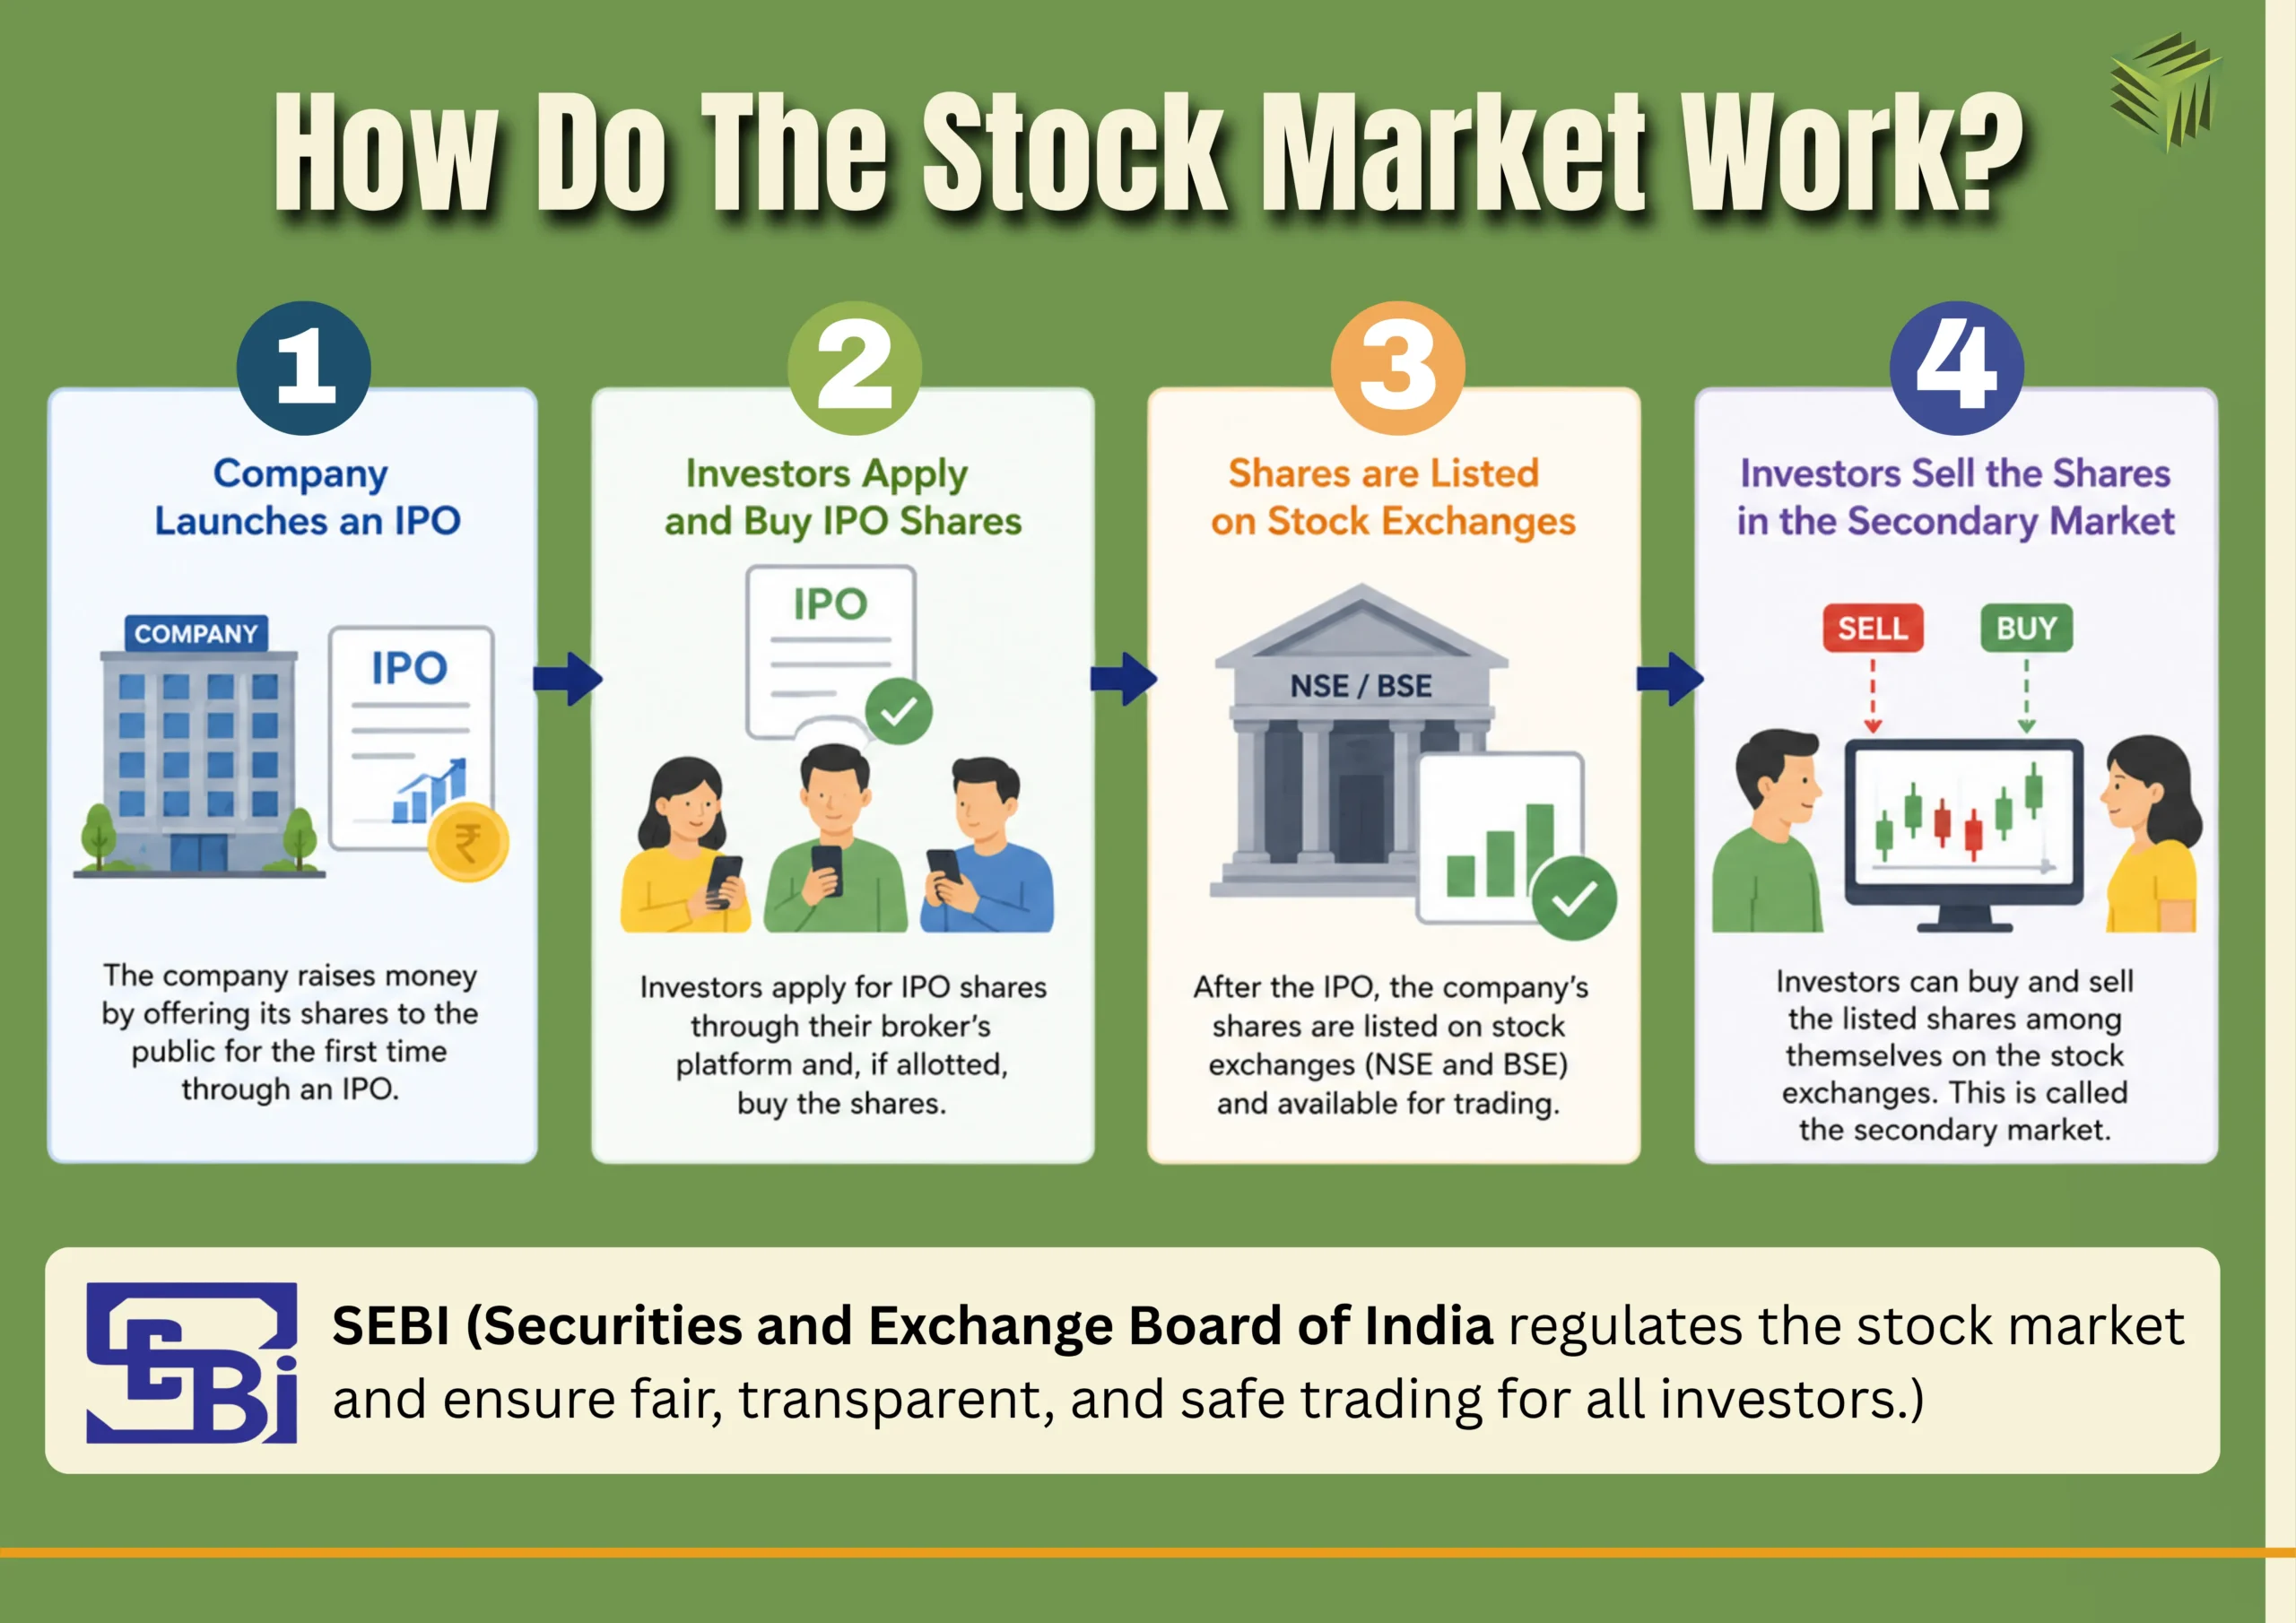
The functioning of the Indian capital markets is monitored by the Securities and Exchange Board of India (SEBI, which establishes standards intended to strengthen transparency, accountability, and investor safeguards.
In addition, the overall health of the market is commonly assessed through benchmark indices, with the Nifty 50 and Sensex serving as the most widely followed indicators in India.
These indices track a selected group of companies and serve as indicators of the overall market’s direction. When most companies in an index rise, the index moves higher. When they decline, the index falls.
NSE vs BSE — What’s the Difference?
The NSE and BSE form the backbone of India’s exchange-traded securities market, providing the infrastructure for share trading and price discovery. However, both differ in scale, history, and market activity.
| Basis | NSE | BSE |
| Introduction | NSE is India’s 2nd largest stock exchange by trading activity. | BSE is the oldest stock exchange in Asia and one of the oldest exchanges globally. |
| Founded in | The NSE was established in 1992. | The BSE was established back in 1875. |
| Benchmark index | Nifty 50 | Sensex |
| Total listed companies | 2700 companies (as of March 2025) | 4,641 companies (as of 12 June 2026) |
| Market capitalisation | ₹410.9 lakh crore (as of March 2025) | ₹462.00 lakh crore (as of 12 June 2026) |
| Liquidity | Higher trading volumes and liquidity | Lower liquidity compared to NSE in most stocks |
Now, how do these Stock Market Indices Work?
A stock market index serves as a benchmark that reflects how a chosen group of companies is performing over time. Instead of tracking thousands of listed stocks individually, investors use indices to understand the overall direction of the market.
The Nifty 50 and Sensex are calculated using the free-float market capitalisation of their constituent companies. The larger companies have a greater influence on index movements. If the majority of companies in an index rise in value, the index moves higher. If they decline, the index falls. As a result, indices act as a quick indicator of market sentiment and economic confidence.
Nifty 50 vs Sensex — Which to Track?
Understanding the Nifty 50 vs Sensex difference is important for every beginner investor. While both indices are used to measure the performance of the Indian stock market, they differ in the number of companies they track and the exchanges they represent.
As discussed above, the Nifty 50 vs Sensex difference primarily lies in their composition. The Nifty 50 derives its value from top 50 companies by market capitalisation, traded on the NSE, whereas the Sensex represents 30 leading companies listed on the BSE. Both indices represent some of India’s most established businesses across multiple sectors and are widely used as benchmarks for market performance.
For beginners, either index can provide a reliable view of the broader market. However, the Nifty 50 covers a larger number of companies and sectors, making it slightly more representative of the Indian equity market. The Sensex, on the other hand, is India’s oldest benchmark index and remains one of the most closely followed indicators of market performance. Many investors monitor both indices to gain a comprehensive view of market trends.
Demat Account Setup for Beginner Investors
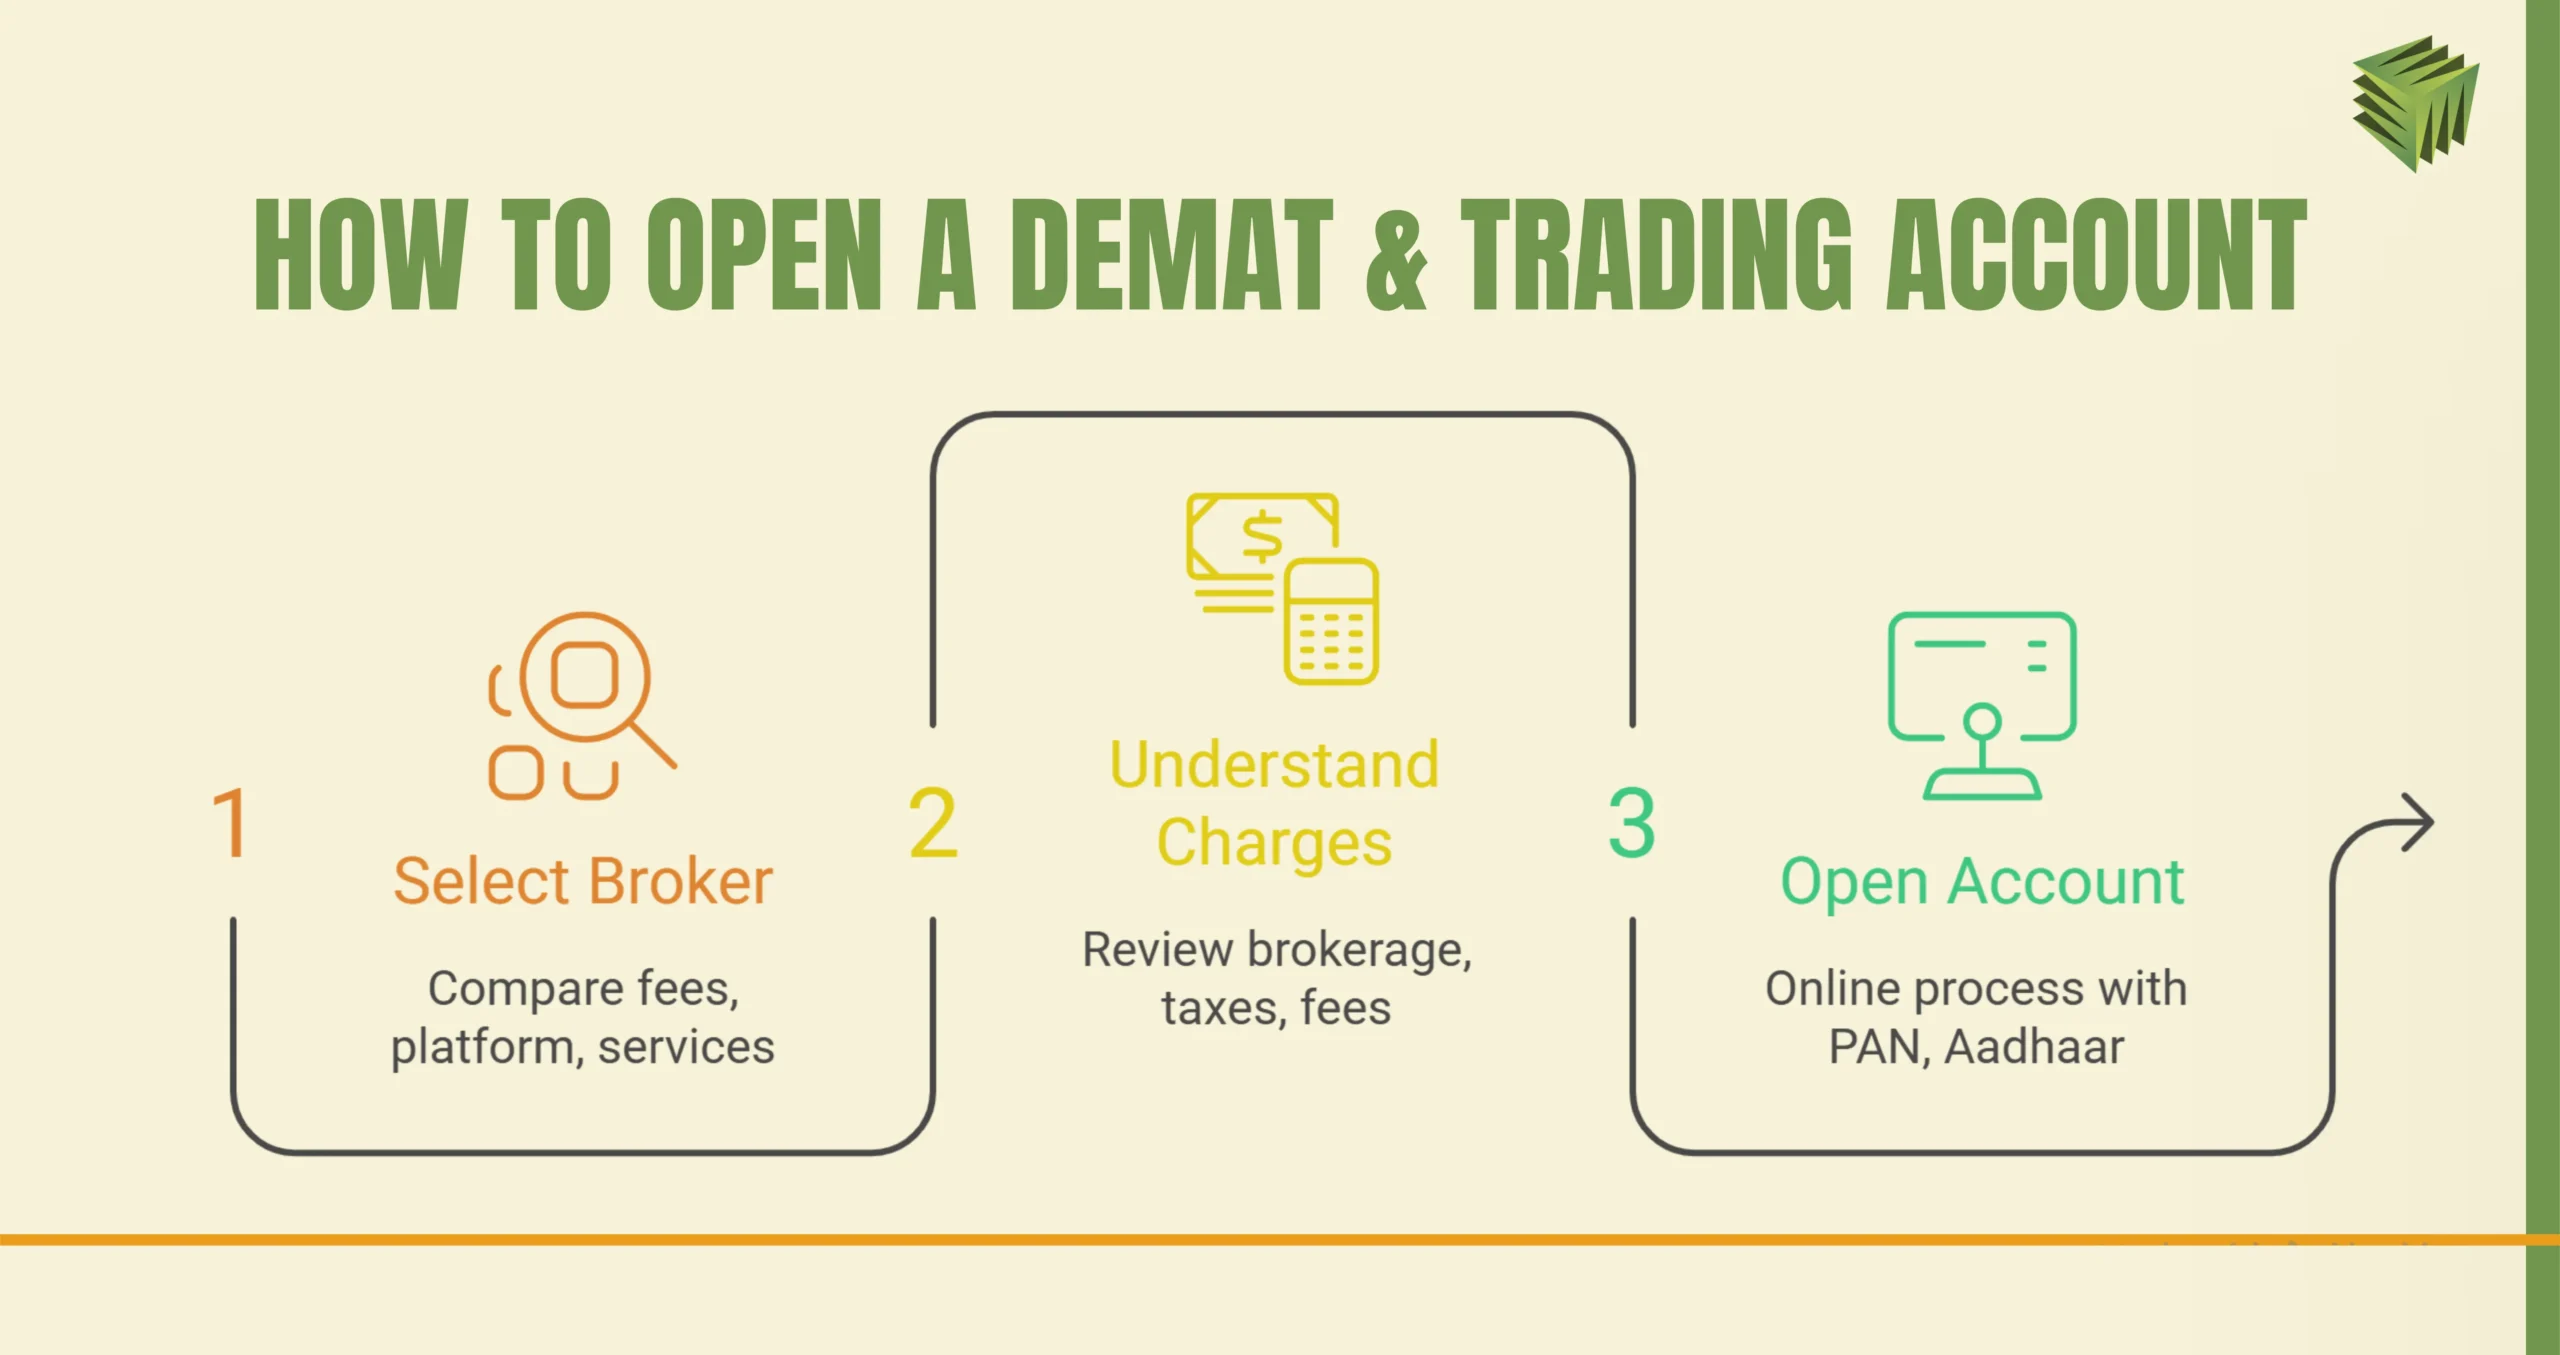
To get started, let us understand a Demat account and trading in brief. Think of a Demat account as the place where your investments are kept and a trading account as the mechanism that allows those investments to be bought or sold. To start investing in the stock market in India, both accounts are essential. Today, most brokers offer a seamless online account-opening process that can be completed within a few minutes using your PAN, Aadhaar, bank account details, and mobile number.
The first step is selecting a suitable stockbroker. You should compare brokers based on account-opening fees, brokerage charges, platform usability, research tools, customer support, and investment options. The discount brokers generally offer lower trading costs, while full-service brokers provide research reports and advisory services.
Before selecting a broker, it is worth examining the different charges that may apply to stock market transactions and account maintenance.
- Brokerage Charges: It is a fee charged by the broker for executing buy and sell orders.
- Securities Transaction Tax (STT): It is a government levy charged on specified securities transactions conducted through recognised stock exchanges in India.
- Depository Participant (DP) Charges: A transaction-related fee incurred when shares are transferred out of a Demat account following a sale.
- Exchange Transaction Charges: These are charges levied by stock exchanges, NSE or BSE, for facilitating trades.
- GST and Stamp Duty: These are statutory taxes applicable to securities transactions.
These charges appear small individually, but they still affect the overall returns, particularly for frequent traders. Since transaction costs directly affect returns, investors should evaluate a broker’s complete pricing model rather than focusing solely on brokerage fees.
Start Investing with ₹1,000
Many beginners believe that stock market investing requires a large amount of capital. In practice, many investors start small, with as low as ₹1,000, and increase their investments as they gain experience.
A practical approach is to begin with financially strong companies, exchange-traded funds (ETFs), or diversified mutual funds while focusing on learning rather than chasing quick returns. Small, consistent investments can benefit from compounding and help build investing discipline.
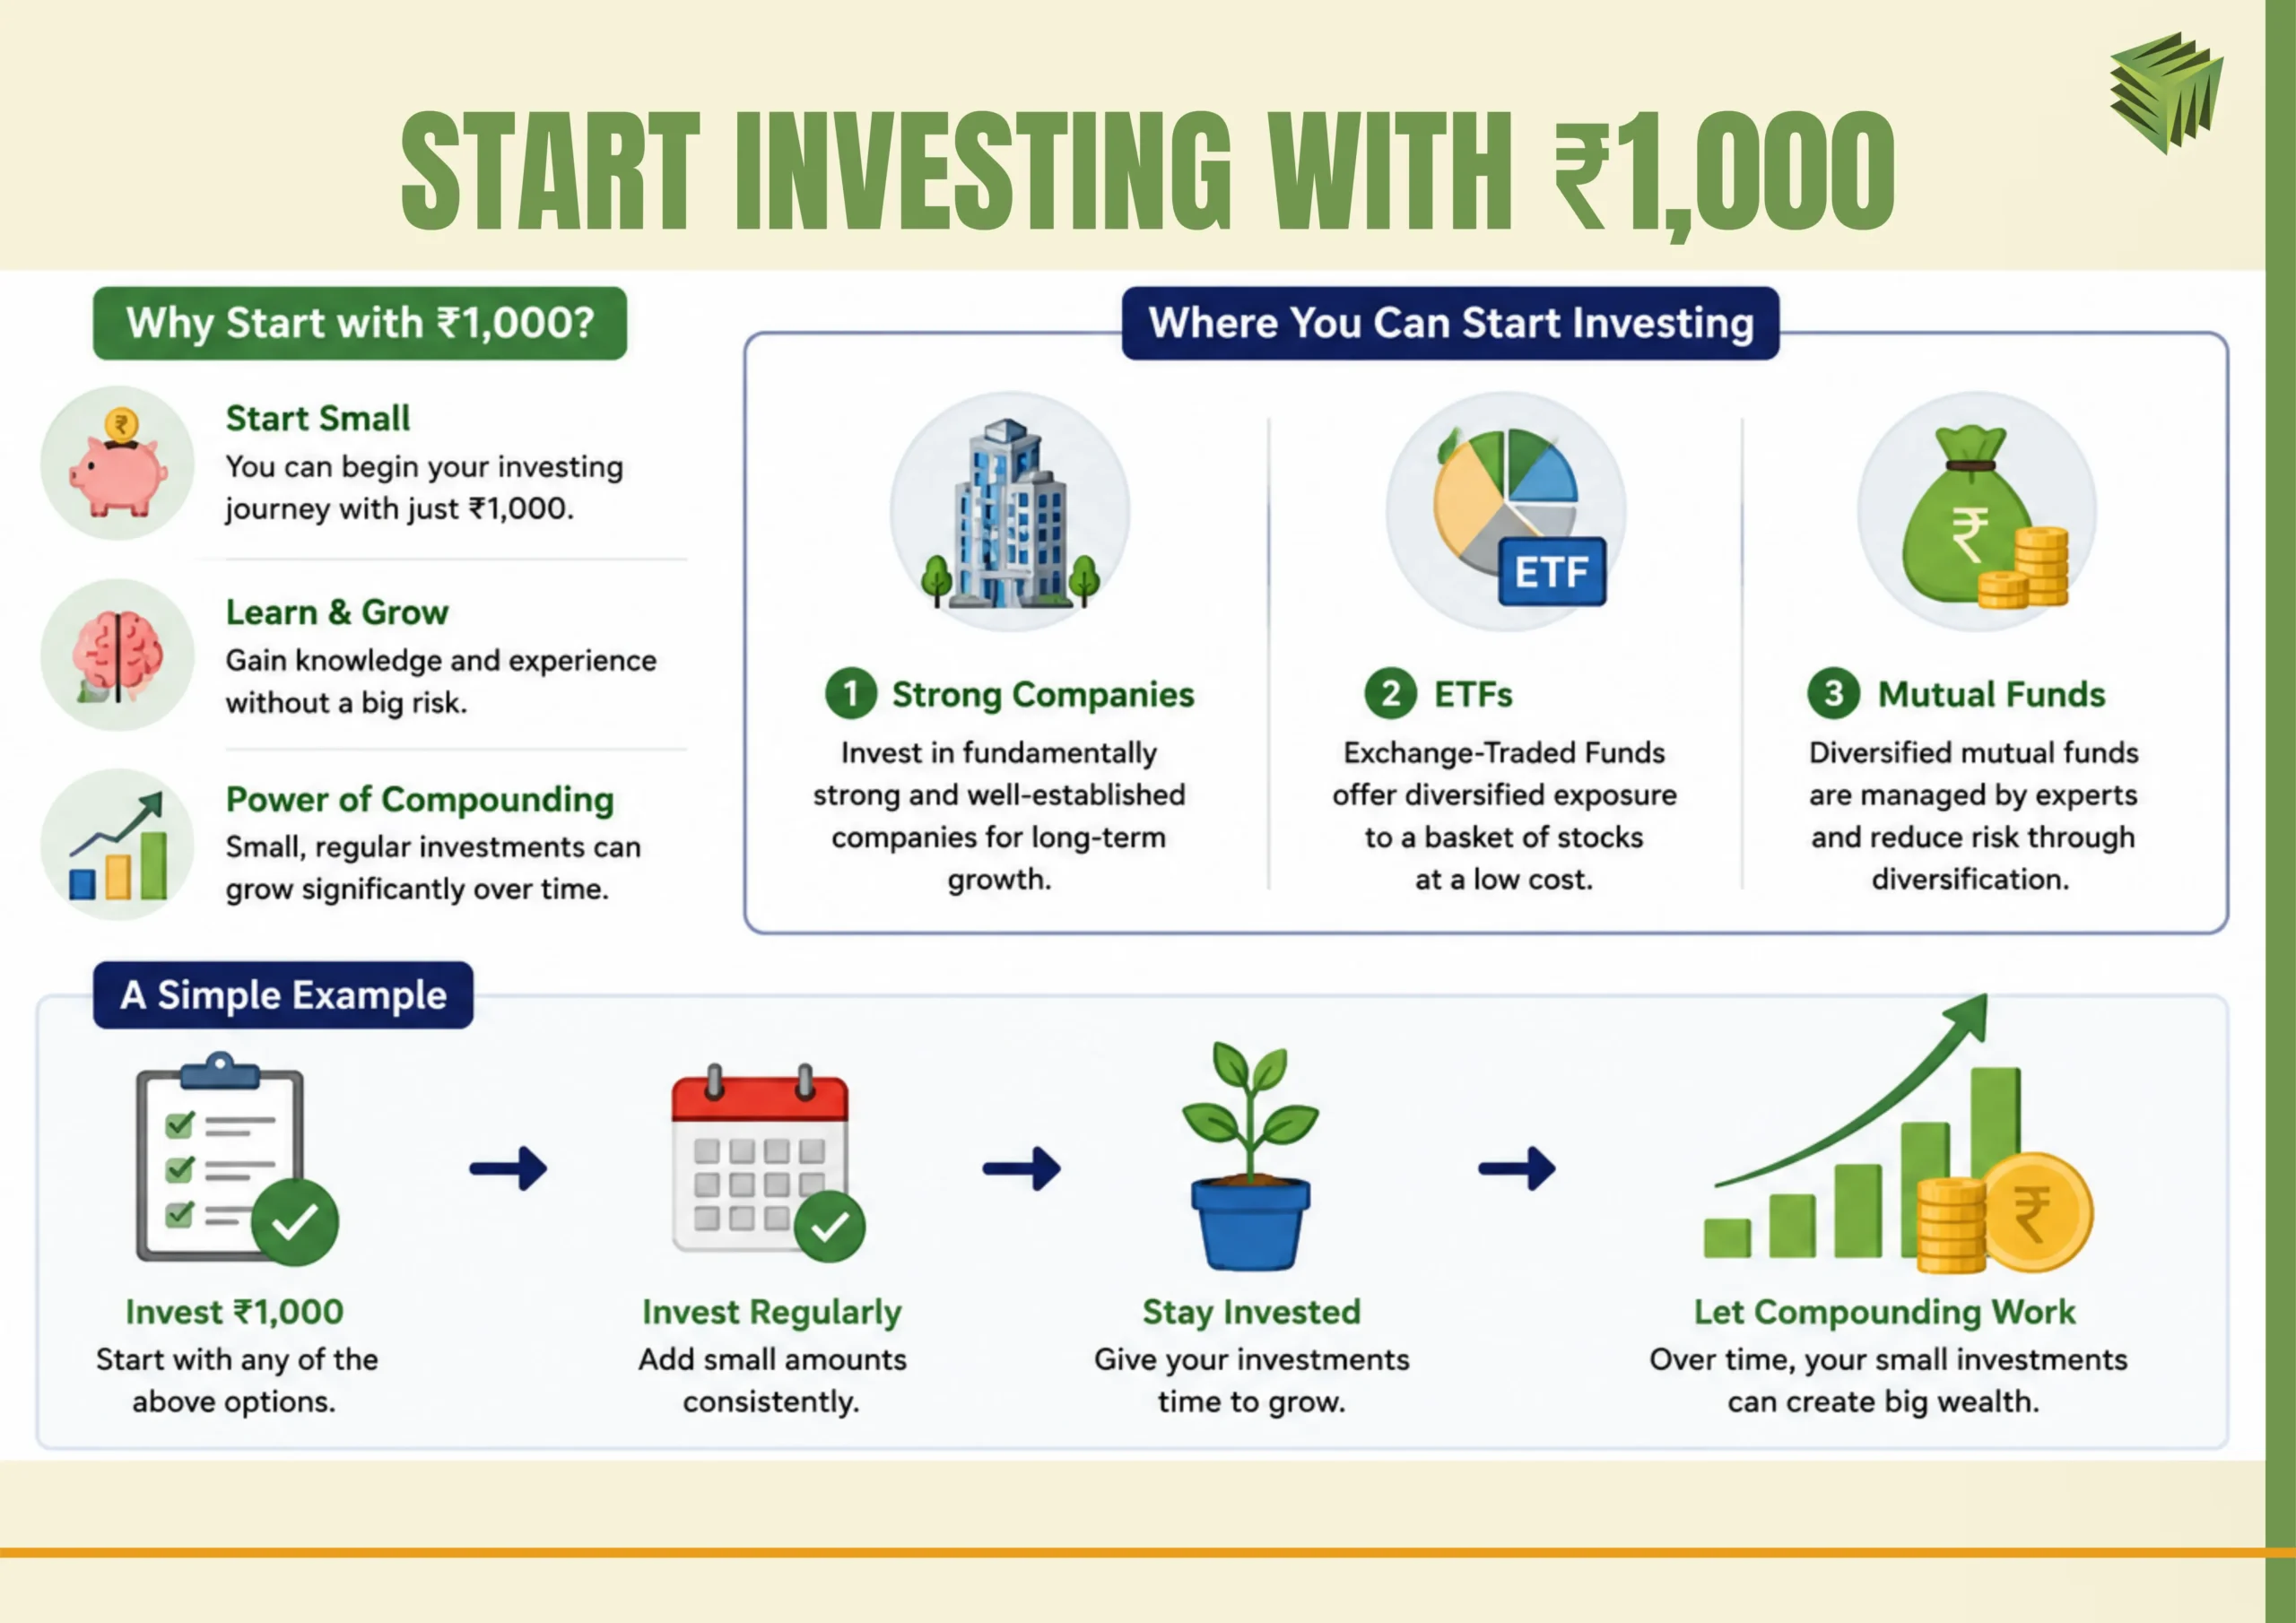
For a detailed step-by-step approach, read the ₹1,000 starter guide, which explains how beginners can make their first investment and avoid common mistakes.
Small-cap vs Mid-cap vs Large-cap — Risk & Return
Market capitalisation is widely used as a framework for classifying companies into different segments, each offering a distinct balance between stability, growth prospects, and investment risk. Understanding smallcap vs midcap vs largecap in India is important because each category offers a different balance between growth potential and investment risk.
| Category | Description | Risk Level | Return Potential | Common Sectors |
| Large-cap | Well-established companies with large market values | Lower | Moderate | Banking, IT, FMCG, Energy |
| Mid-cap | Medium-sized companies with growing businesses | Moderate | Moderate to High | Manufacturing, Consumer Goods, Healthcare |
| Small-cap | Small companies with comparatively lower market valuations but greater scope for future expansion | Higher | High | Emerging Industries, Technology, Specialty Businesses |
Large-cap stocks are generally more stable and less volatile, making them suitable for conservative investors. Midcap stocks offer a balance between stability and growth, while smallcap stocks can deliver substantial returns but often experience sharper price fluctuations. Most investors diversify across all three categories to balance risk and return.
For a detailed comparison, read the Small-cap vs Mid-cap vs Large-cap guide.
Growth, Value & Dividend Stocks
Apart from market capitalisation, stocks can also be grouped according to their investment characteristics.
- Growth Stocks: These are companies that prioritise expanding sales, earnings, and market share, often reinvesting profits to support future growth. Investors typically buy them for capital appreciation rather than regular income.
- Value Stocks: These are companies that appear undervalued relative to their earnings, assets, or future prospects. These stocks often attract investors looking for bargains.
- Dividend Stocks: These companies are known for rewarding their shareholders with regular dividend payments alongside potential capital appreciation. Many investors favour dividend stocks for generating passive income alongside potential capital gains.
While none of these categories is inherently superior, growth stocks may offer relatively higher upside. Value stocks can offer opportunities to invest in fundamentally sound businesses at favourable valuations, and dividend stocks provide an additional return component through cash distributions. The allocation between these segments generally depends on individual preferences, investment priorities, and market outlook.
How to Pick Stocks Using Fundamental Analysis
Fundamental analysis for beginners involves evaluating a company’s financial health, business model, profitability, and growth prospects before investing. The objective of fundamental analysis is to evaluate whether a company’s financial strength and business prospects justify its market valuation.
A good starting point is to examine a company’s revenue growth, profit growth, debt levels, return on equity (ROE), and cash flow. Consistent growth in sales and profits often indicates a healthy business, while excessive debt can increase financial risk.
You can access this information through financial research platforms such as Screener.in, company annual reports, and stock exchange filings. These resources provide detailed financial statements and key ratios that help compare companies within the same industry.
Read the Fundamental Analysis Tutorial and Balance Sheet guide for detailed information.
How to Read a Balance Sheet
Understanding how to read a balance sheet in India is one of the most important investing skills. A balance sheet provides an overview of a company’s financial foundation by detailing its assets, liabilities, and shareholders’ equity.
To interpret a balance sheet effectively, investors should understand the following three elements:
- Assets: The financial and physical resources available to a business, including cash, inventory, equipment, and investments.
- Liabilities: Money the company owes, including loans and other obligations.
- Shareholders’ Equity: The net value available to shareholders once the company’s debts and obligations are deducted.
The relationship between a company’s assets, liabilities, and equity can provide valuable insights into its financial strength. Investors often compare these figures over multiple years to identify improving or deteriorating financial trends.
PE Ratio Explained in India for Beginner Investors
The Price-to-Earnings (P/E) ratio helps investors assess the relationship between a company’s market price and its profitability. A PE ratio explained in India can help beginners understand whether a stock is trading at a premium or a discount compared with its earnings.
The ratio indicates how the market values a company’s earnings relative to its current share price. Its formula is:
| PE Ratio = Share Price ÷ Earnings Per Share (EPS) |
For example, a PE ratio of 20 means investors are paying ₹20 for every ₹1 of annual earnings generated by the company.
However, a high PE ratio does not automatically mean a stock is expensive, nor does a low PE ratio always indicate a bargain. The ratio is generally compared with industry peers, historical valuations, and future growth expectations.
Some other useful ratios for beginners include:
- ROE (Return on Equity): The ratio indicates how efficiently management uses shareholder funds to produce earnings.
- Debt-to-Equity Ratio: It evaluates the financial leverage of a company.
- Net Profit Margin: The metric reveals how effectively a business turns its revenue into net earnings after expenses.
- Earnings Per Share (EPS): It shows the profit attributable to each share.
Taken together, these indicators offer a wider perspective on a company’s financial performance and valuation.
Technical Analysis for Beginners
Where fundamental analysis seeks to estimate a company’s intrinsic value, technical analysis focuses on interpreting market price action and momentum. It is commonly applied to evaluate market direction, momentum, and potential trend changes.
The foundation of technical analysis is the candlestick chart. The structure of a candlestick represents the opening, closing, highest, and lowest prices recorded during a given period. By analysing candlestick patterns, traders attempt to identify shifts in market sentiment.
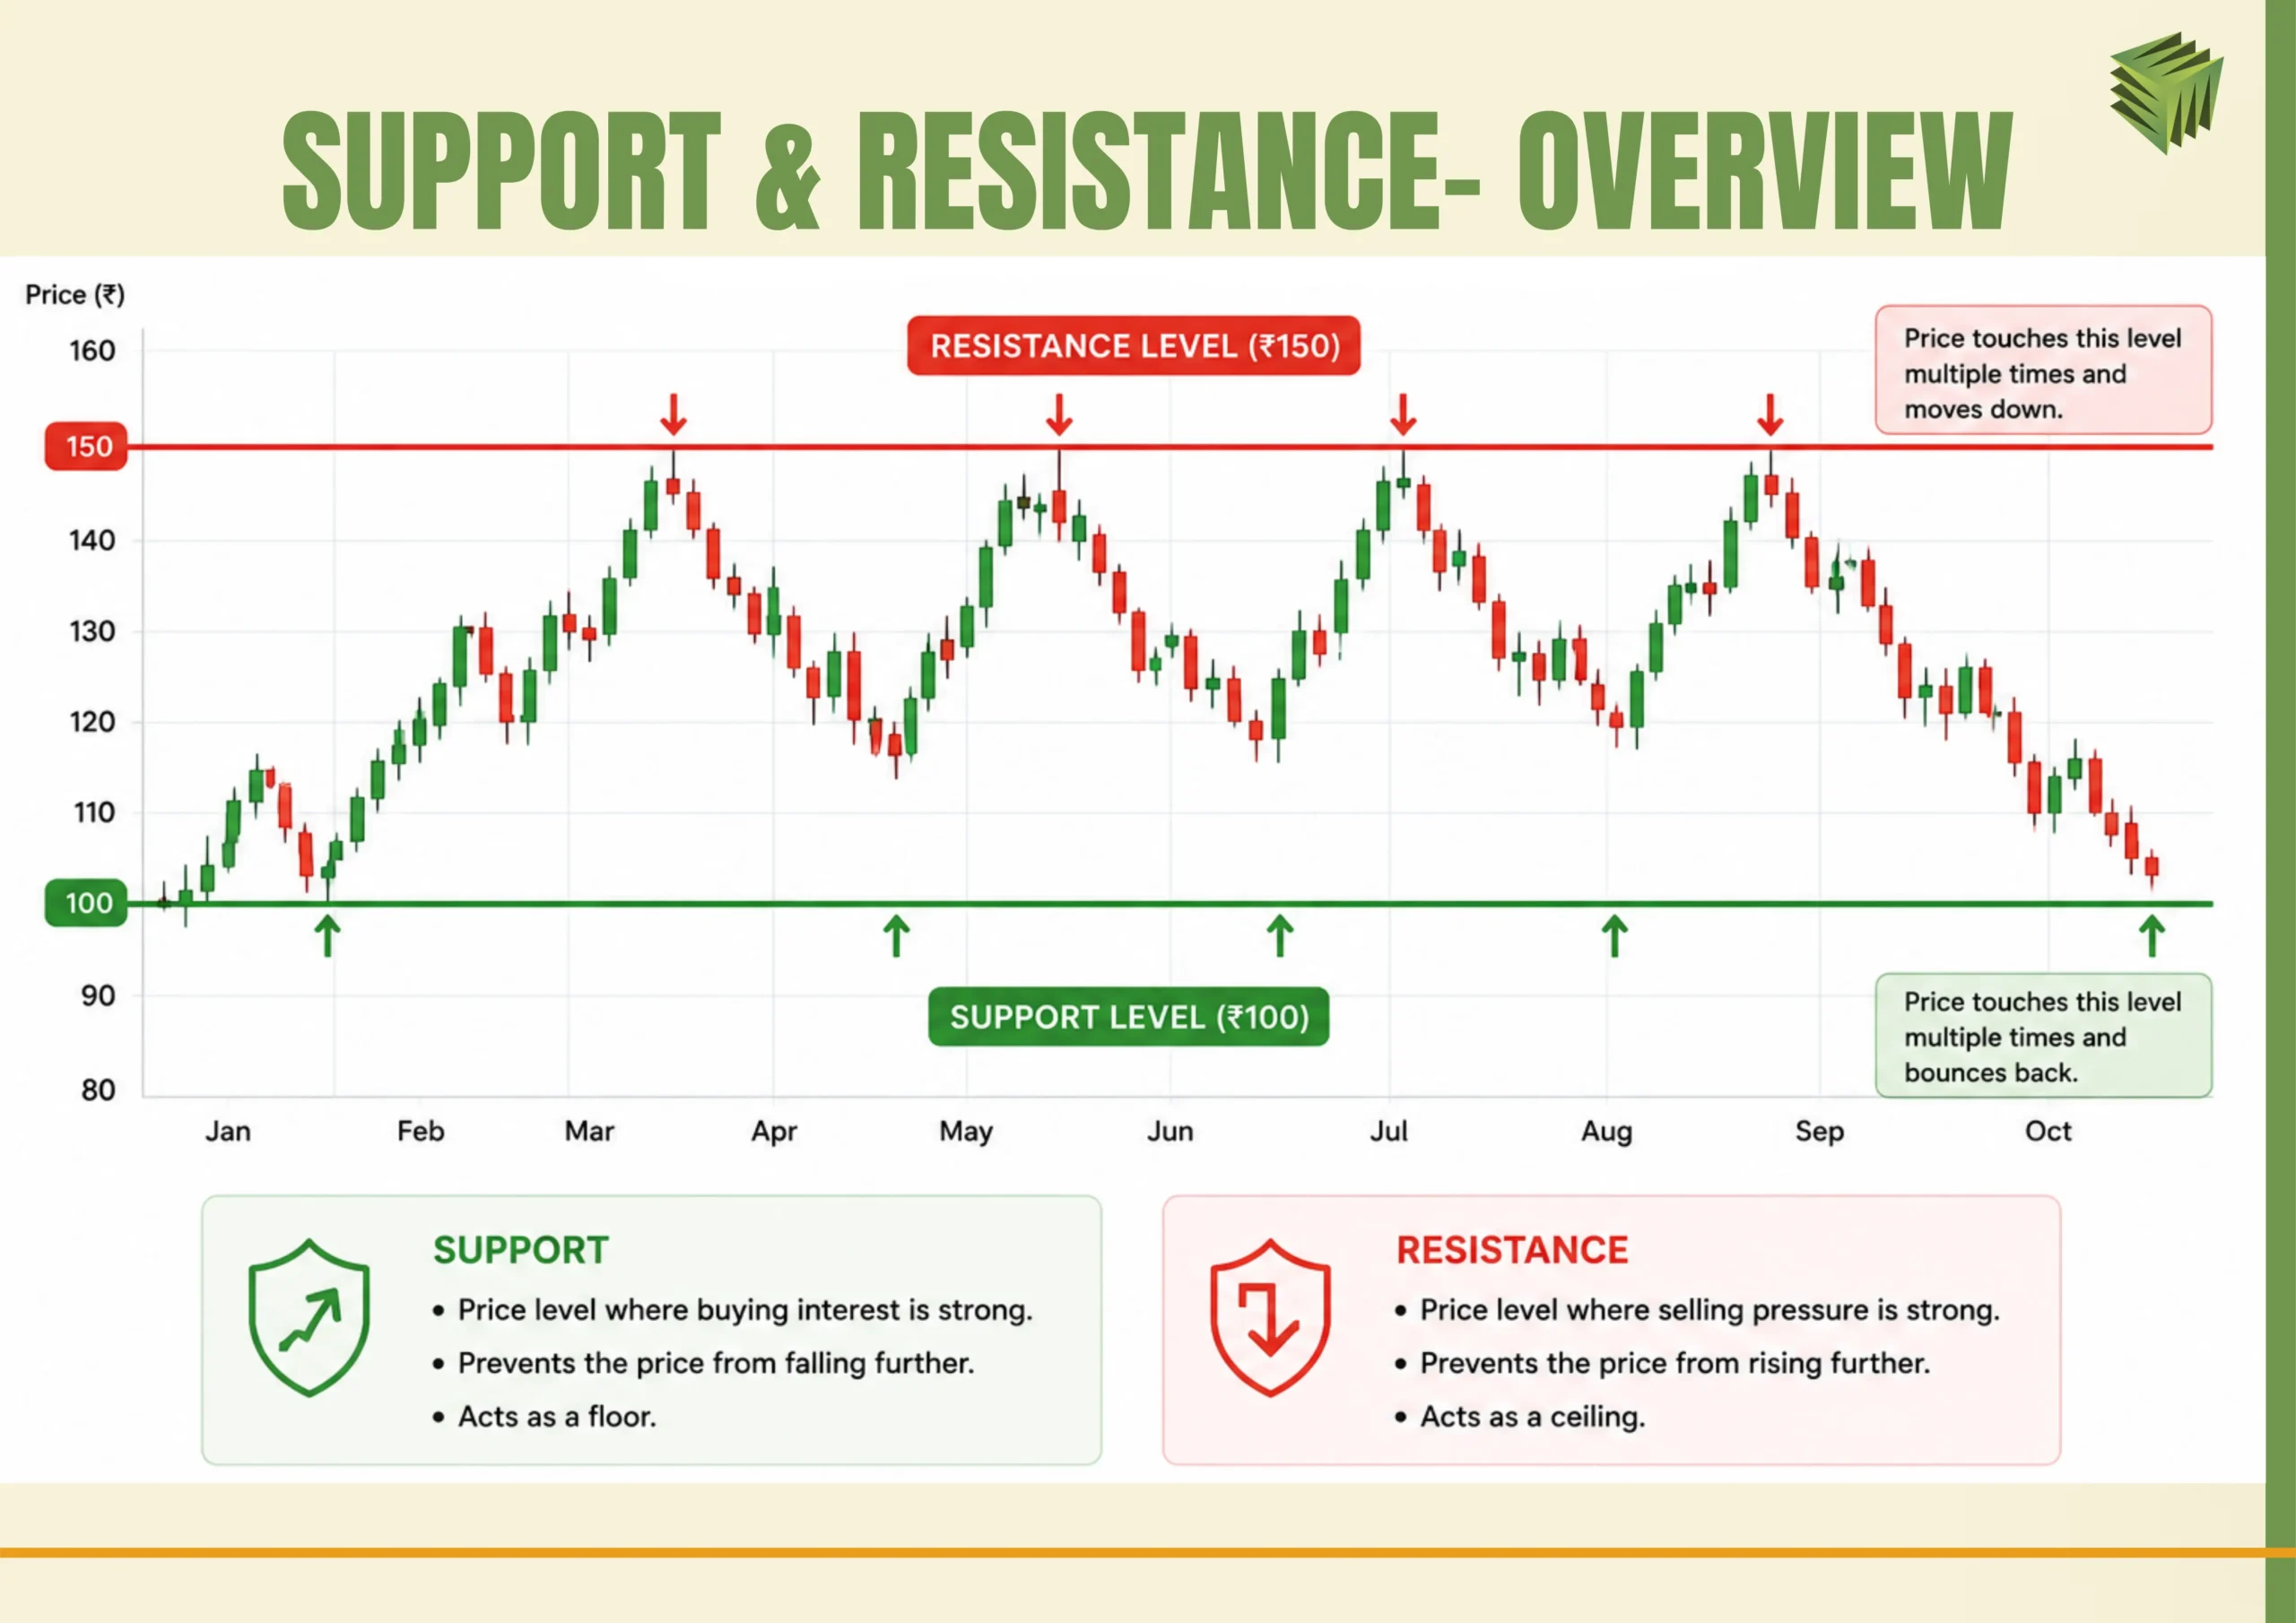
Another important concept is support and resistance. Support highlights a level where demand has previously been strong enough to limit downward movement. Resistance refers to a price area where selling activity often increases, which can slow, halt, or reverse an upward trend.
Technical analysts or technicians also use certain indicators to evaluate momentum and trends, which are:
- RSI (Relative Strength Index): It evaluates the strength of recent price movements and helps identify momentum shifts. An RSI above 70 may indicate overbought conditions, while a reading below 30 may suggest oversold conditions.
- MACD (Moving Average Convergence Divergence): It helps identify trend direction and potential trend reversals by comparing moving averages.
Although technical analysis can assist with entry and exit decisions, it is most effective when combined with sound risk management and a good understanding of market conditions.
Understanding Circuit Breakers
A circuit breaker in the stock market in India is a regulatory mechanism that temporarily pauses trading during sharp market movements. When benchmark indices such as the Nifty 50 or Sensex rise or fall by a predefined percentage within a trading session, trading may be temporarily halted across the market.
These pauses help in preventing panic-driven buying or selling and provide investors with time to assess market developments before trading resumes. Circuit breakers are triggered at different levels based on the magnitude of the market movement.
For a detailed breakdown of trading halts, trigger limits, and market-wide safeguards, read Circuit Breaker explainer.
How to Earn Passive Income from Dividend Stocks
Some companies reward shareholders by distributing a portion of their profits as periodic dividends. The shares of such companies are commonly known as dividend stocks. These payments are usually made on a quarter, semi-annual, or annual basis, which can provide a regular income stream alongside potential capital appreciation.
Many investors generally include dividend-paying companies in their portfolios to generate passive income without having to sell their investments. The companies with stable cash generation, healthy profitability, and a proven operating track record are often more likely to maintain consistent dividend payments.
Investors, while evaluating the best dividend stocks in India, also focus on key metrics such as dividend yield and payout ratio. Let us discuss them briefly:
- Dividend Yield: It indicates the percentage return an investor receives through annual dividend payments relative to the stock’s current market price. For example, a stock priced at ₹200 that distributes ₹10 per share annually offers a dividend yield of 5%.
- Payout Ratio: This indicates the percentage of a company’s profits distributed as dividends. A very high payout ratio may not always be sustainable, while a moderate ratio can suggest that the company is balancing shareholder payouts with future growth investments.
In addition, you should also consider factors such as earnings stability, cash flow generation, debt levels, and dividend payment history before selecting dividend stocks. A company that has consistently increased dividends over many years may be more attractive than one offering a temporarily high yield.
For stock ideas and detailed comparisons, explore our Dividend Stocks listicle, which covers some of the best dividend-paying companies across different sectors and market capitalisation categories.
Which Market Approach Matches Your Goals: Intraday Trading or Long-term Investing?
Whether you prioritise quick opportunities or gradual wealth creation, understanding Intraday vs Long-Term investing can help you choose an approach that matches your financial goals, risk tolerance, available time, and investment experience.
| Factor | Intraday Trading | Long-Term Investing |
| Holding Period | The position is squared off before the end of the trading day | Investments are held for years |
| Objective | Profit from short-term price movements | Build wealth through long-term growth |
| Time Commitment | Requires continuous market monitoring | Requires periodic portfolio reviews |
| Risk Level | Generally higher due to market volatility | Generally lower when diversified |
| Analysis Focus | Technical analysis and market trends | Fundamentals, earnings, and business quality |
| Tax Treatment | Taxed as business income | Subject to capital gains taxation |
Risk Profiles:
Intraday trading is suitable for individuals who can handle frequent market fluctuations and are comfortable making quick decisions under pressure. Since trades are executed within a single day, losses generally accumulate faster if proper risk management is not applied. Long-term investing, in contrast, is considered better for investors who prefer a patient approach and can withstand short-term market volatility while focusing on long-term wealth creation.
Tax Differences:
Intraday trading profits are treated as income from business and taxed according to the applicable investor’s tax slab. Long-term investing attracts capital gains tax, with rates varying based on the asset class and holding period.
Who Should Choose Which?
Intraday trading may suit experienced market participants with sufficient time and discipline. Long-term investing is generally more appropriate for beginners, salaried individuals, and those aiming to achieve financial goals through steady wealth accumulation.
How to Recover from Stock Market Losses
Experiencing losses is a natural part of investing. The key is not to focus on recovering losses quickly but to understand what went wrong and make better decisions moving forward.
From a psychological perspective, you should avoid making emotional decisions after a loss. Emotion-driven investment behaviour following a loss often results in higher risk-taking and unfavourable outcomes. A more effective approach is to assess previous investment decisions, identify areas for improvement, and maintain alignment with long-term financial objectives.
Next, financial recovery begins with analysing the reasons behind the loss. You need to assess whether the setback resulted from poor stock selection, lack of diversification, excessive risk-taking, or market conditions. Reviewing the portfolio, reducing unnecessary risks, and concentrating on fundamentally strong investments can help create a more balanced approach. Additionally, regular investing through SIPs or disciplined investment plans can also support gradual wealth creation over time.
Tax on Stock Market Profits in India
Understanding how stock market profits are taxed is just as important as generating returns. The different tax rules applied to long-term investments, short-term trades, and derivatives transactions make tax planning an essential part of successful investing.
Taxation of equity investments is largely determined by the holding duration of the asset. Profits from listed shares and equity-oriented mutual funds are generally categorised as either short-term or long-term capital gains for tax purposes.
STCG vs LTCG
Equity shares sold within 12 months of purchase generally fall under the Short-Term Capital Gains (STCG) category. Under the prevailing tax provisions, eligible STCG on listed equities is taxed at 20%.
When the holding period exceeds 12 months, the profit is ordinarily classified as Long-Term Capital Gains (LTCG). LTCG exceeding the ₹1.25 lakhs exemption limit is taxed at 12.5% without indexation benefits.
F&O Taxation as Business Income
Profits and losses from Futures and Options (F&O) trading are treated as business income rather than capital gains. The amount payable as tax varies according to the taxpayer’s income slab and prevailing tax regulations. F&O traders may also be subject to additional compliance requirements, such as maintaining records and, in certain cases, tax audits, depending on turnover and income conditions.
Since tax regulations can change through annual Budgets and policy updates, you should regularly review the latest provisions. For a detailed explanation of capital gains, tax filing, deductions, and compliance requirements, explore our Tax Category Guide.
Choosing the Best Stock Broker in India
Selecting the right stockbroker is an important decision because your trading experience, investment costs, and access to market tools largely depend on the platform you choose. Investors in India can generally choose between discount brokers and full-service brokers.
Discount brokers focus on low-cost trading and digital-first platforms. Popular names such as Zerodha, Groww, and Upstox offer competitive brokerage plans, user-friendly mobile applications, and efficient account management tools. Full-service brokers, on the other hand, provide additional services such as research reports, investment advisory, relationship managers, and wealth management solutions, often at a higher cost.
Hidden Charges to Know
Many investors compare brokers based only on brokerage fees, but other charges can significantly affect overall costs. These may include:
- Account opening fees
- Annual maintenance charges
- Call-and-trade fees
- Margin interest
- Platform subscription fees
- Charges for pledging or unpledging securities
Additionally, regulatory charges, GST, stamp duty, and Securities Transaction Tax (STT) should also be considered when calculating trading expenses.
Broker selection should be guided by the investor’s objectives, transaction frequency, cost considerations, and desired level of service. Before opening an account, compare costs, platform features, customer support quality, and available research tools. For a detailed comparison of leading platforms, explore our Brokers Category Guide, including Zerodha vs Groww vs Upstox comparisons.
Bottomline
While commonly associated with buying and selling shares, the stock market also supports economic growth and corporate expansion. Market fluctuations, investment risks, and taxation can appear complex initially, but an understanding of market fundamentals can significantly improve decision-making.
By focusing on quality investments, diversification, disciplined investing, and continuous learning, beginners can build a strong foundation for long-term wealth creation and financial independence.
Frequently Asked Questions
How much money do I need to start investing in the stock market?
You can start investing with as little as ₹100 or ₹1,000, depending on the share price or investment product chosen. Many beginners begin with small investments and gradually increase their allocation as they gain confidence and experience.
Is investing in stocks risky for beginners?
All investments carry some degree of risk. However, investing in fundamentally strong companies, diversifying across sectors, and maintaining a long-term perspective can help reduce risk and improve the likelihood of achieving favourable outcomes.
What is the difference between a Demat account and a trading account?
A Demat account stores shares and securities in electronic form, while a trading account is used to place buy and sell orders on stock exchanges. Both accounts are required for investing in listed Indian equities.
Can I invest in the stock market without tracking it every day?
Yes. Long-term investors do not need to monitor the market daily. Periodic portfolio reviews, combined with investments in quality companies or diversified funds, are often sufficient for achieving long-term financial objectives.
What are blue-chip stocks?
Blue-chip stocks are shares of large, financially stable, and well-established companies with strong business models and consistent performance records. These companies are often industry leaders and are generally considered less volatile than smaller firms.
What is the best strategy for beginners in the stock market?
Beginners should focus on learning the basics, investing regularly, diversifying their portfolio, and avoiding speculative trades. Building wealth gradually through disciplined investing is often more effective than attempting to generate quick profits.
How often should I review my investment portfolio?
Most long-term investors review their portfolio quarterly, half-yearly, or annually. Frequent monitoring can encourage emotional decision-making, while periodic reviews allow investors to assess performance and rebalance allocations when necessary.
What happens if a company I invest in is delisted?
If a company is delisted, its shares may no longer trade on a recognised stock exchange. Investors may receive an exit opportunity from promoters or continue holding the shares, depending on the circumstances of the delisting.
Should beginners invest in individual stocks or mutual funds?
Both options have advantages. Individual stocks offer direct ownership and potentially higher returns, while mutual funds provide professional management and diversification, making them suitable for investors with limited market knowledge.
How can I avoid common stock market mistakes?
Investors can reduce mistakes by conducting research before investing, avoiding herd mentality, maintaining diversification, controlling emotions during market volatility, and following a well-defined investment plan aligned with their financial goals.


